Tooling
Sippy
Sippy is a central location for many of TRT’s tools.
Component Readiness
Component Readiness is one of the newest and most important portions of Sippy. Component Readiness analyzes huge quantities of test data comparing the last week (by default) of the current dev release, against the last month leading up to GA for the most recent stable release. It uses Fisher’s Exact Test to determine if any test is failing statistically more often.
See the Component Readiness page for more documentation.
Sippy Classic
An older portion of Sippy offers many tools that are still helpful in analyzing CI signal including:
- Release Overview page showing high level indicators and most regressed jobs/tests.
- Payload Streams, a permanent archive of payloads coming out of the Release Controller (where they are eventually garbage collected), as well as what PRs were in them, and some analysis of how the testing went.
- Job and Test Details pages with helpful analysis.
- Overview pages for Infra, Install and Upgrade success rates across variants, and which areas are struggling.
- A full Presubmits section for examining job/test pass rates in presubmits, how repos are doing with their overall presubmits, and a very helpful index of Pull Requests which can be filtered on merge time.
Alerting
TRT’s tooling can send your team Slack alerts on metrics that Sippy publishes. This includes job pass rates over the past days/week, and Component Readiness regressions for your component.
Alerts are defined in the private continuous-release-jobs repository for the DPCR cluster (check the README.md file in the trt-monitoring directory to setup the integration).
When an alert fires in your slack channel, following the link provided will take you to Alertmanager. Here the alert can be silenced if you feel it is correct and safe to do so. Choose an appropriate timeframe to silence for as the problem is worked on, and identify yourself as the creator.
To request additional metrics to be published by Sippy, please file a JIRA issue in the TRT project.
Silencing Alerts
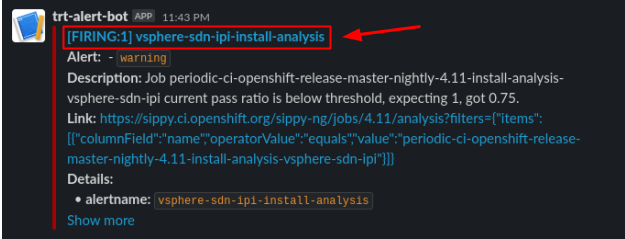
If you wish to silence an alert for a period of time while you’re working on fixing the underlying problem, click on the [FIRING] message on Slack:
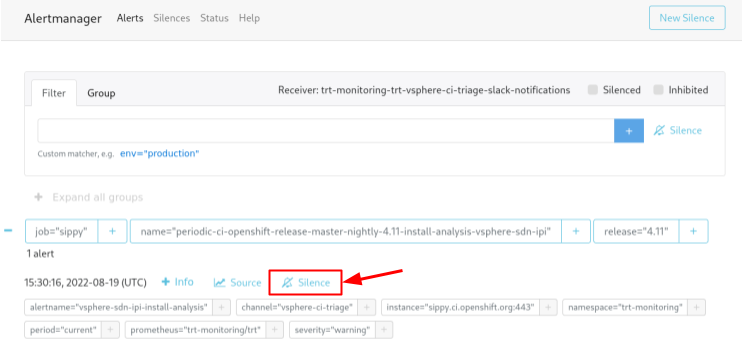
In alert manager, click Silence on the particular alert you wish to silence:
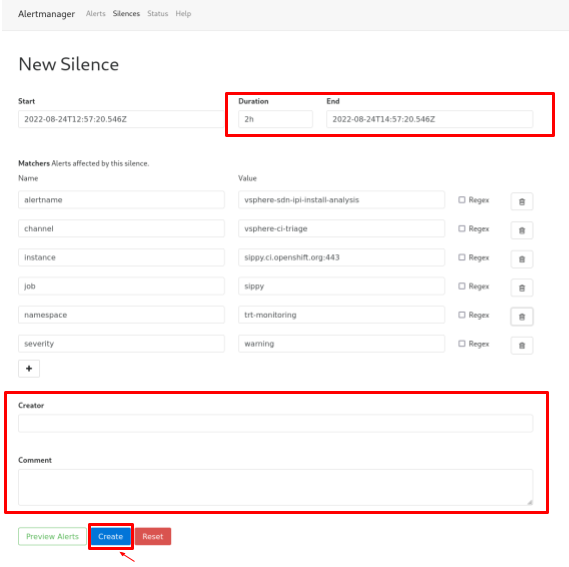
On the silence page, set a duration, add a note, enter your name, and then click Create:
Release Controller
The Release Controller handles the regular process of assembling the various components of OpenShift into a release payload image, and running a number of jobs against that payload. On the status page you’ll see a breakdown for each release, and a CI/nightly payload. CI payloads track closer to master and build from source, nightly payloads are driven through the ART infrastructure and can be selected as official product builds for release. As a result nightly payloads are tested much more heavily. They are also susceptible to outages/delays in the official Red Hat build systems.
There is also a status page for other architectures, these are not yet a priority for us but will be as multiarch and the heterogenous payload evolves.
The Release Controller status page is always our top priority, to keep the payload green. This is important not just because we want to keep the product in a shippable state, but also because the longer between green payloads, the larger the changelog becomes. This changelog is important as it helps us spot the commits that may have caused a regression and begin testing.
Payloads do get cleaned out of the Release Controller regularly, however Sippy’s Payload Streams UI provides a permanent record, as well as some interesting tooling around viewing the test failures across multiple jobs in the payload run, and trying to identify if a test appears to be a problem across multiple consecutive payloads. There is a slight delay before payloads appear in Sippy, typically within an hour of the last job completing on the payload.
For more on the Release Controller, see Payload Testing.
Search.CI
Search.CI allows searching through junit failures, build logs, and open Jiras over the past several days. This can be extremey useful for checking if a problem is still occurring, as well as surfacing bugs that may already be open and actively worked.
After performing a search, the “chart view” link will show a potentially useful visualization of the hits for your search over time. Sometimes this can help spot when a problem started/stopped occurring.
The tool also features the ability to chart metrics for a subset of cluster metrics.
- Are you hitting timeouts and want to see if the duration of the job has increased
- Is there a sudden increase in api errors
ProwJob Tools and Artifacts
The prow interface for a job run contains an immense number of tools and artifacts, see Troubleshooting Job Failures for details.
BigQuery
TRT makes heavy use of bigquery as a data warehouse for archiving test and job runs, disruption and alerts observed, etc.
We use two projects:
- openshift-ci-data-analysis: Stores observed disruption and alert data from CI job runs, as well as arbitrary autodl artifacts.
- openshift-gce-devel: Stores the pass/fail status of every test run for every job (which powers Component Readiness and aggregated jobs), all intervals scraped from job runs, triage and regression tracking data, etc.